


Happy Easter!


May your Easter be filled with the sweet joys of spring, the warmth of loved ones, and the blessings of renewal. Wishing you a day as bright and beautiful as the flowers in bloom, and may your heart be filled with hope, love, and endless possibilities.
Please scroll down for updates on the current real estate market, my 2023 Year in Review Booklet, and our available inventory of beautiful listings.
If you have any questions, please do not hesitate to reach out.
510-406-4836


Sellers retain, as they always have, the discretion to offer compensation to buyer’s brokers. The proposed settlement does not prohibit their ability to do so.
Commissions have always been and will continue to be negotiated through transparent conversations with our clients. We believe strongly in transparency around broker compensation.
Commissions have always been negotiable and are not set by law. Reduced fee alternatives have been and will continue to be available for consumers seeking those options.
The proposed settlement would require that every buyer represented by an NAR-affiliated agent sign a Buyer Representation Agreement outlining the relationship between the buyer and broker before touring a property, something that is already required in many states for over a decade.
Buyers deserve representation at every income level. Our experience has shown that transactions flow more smoothly when there is professional representation on each side, creating open lines of communication which benefit all parties involved.
Compass agents provide tremendous value to our clients. As a result, we will continue to encourage a transparent commission conversation that reflects the time, effort, expertise, and support we invest in each transaction.
Compass is fully prepared to adopt the changes laid out as part of the settlement. We see these updates as being positive both for our clients and for the brokerage community, as they provide additional transparency and clarity and will encourage the most professional agents to thrive.


Take a moment to browse my 2023 Year in Review Booklet. Discover firsthand the dedication, expertise, and commitment to excellence that define my real estate approach.


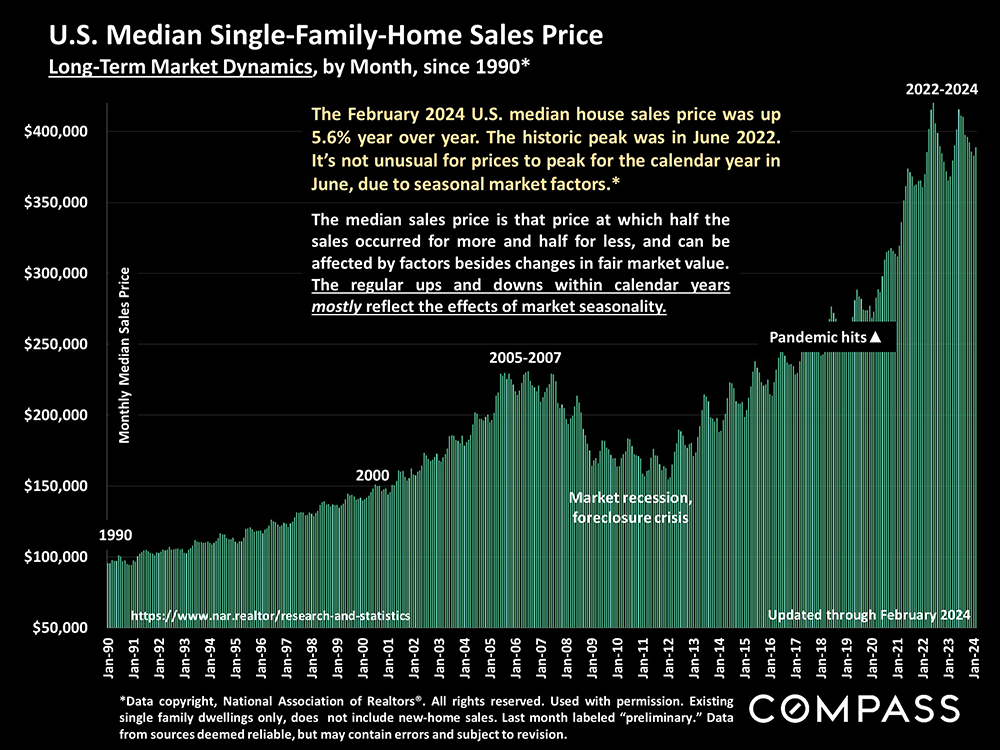
A long-term view of the national median house sales price since 1990. Due to seasonal supply and demand factors, median sales prices usually peak in spring.
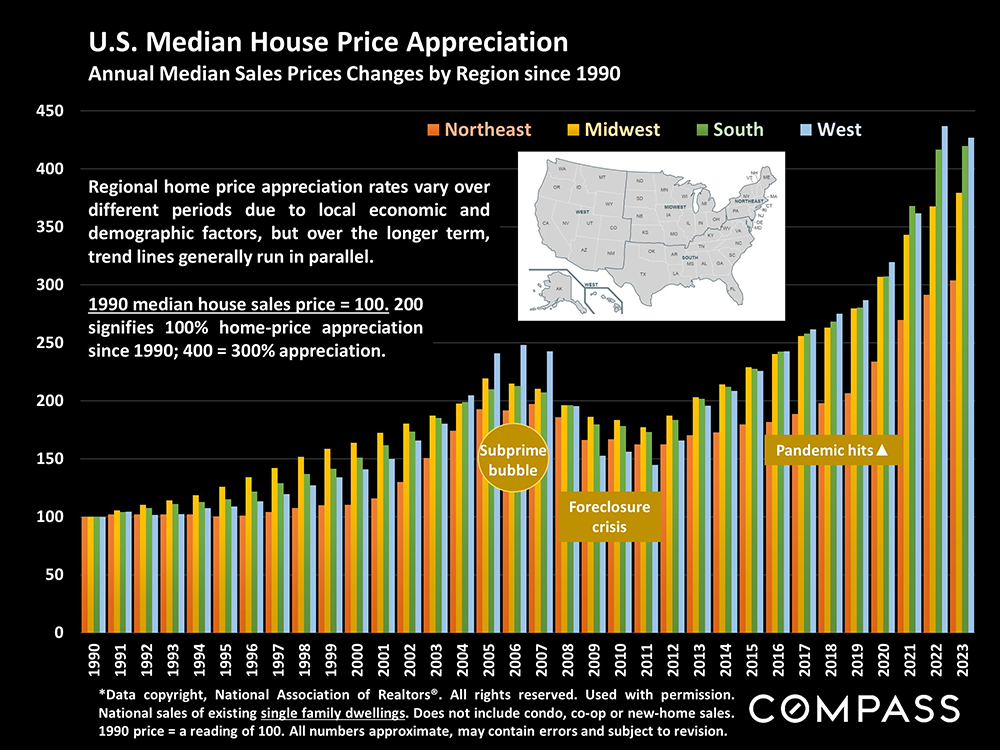
Annual median house prices for the 4 U.S. regions: Prices & appreciation rates vary due to local conditions, but because of national macroeconomic factors, regional trends up and down are usually quite similar over the longer term.
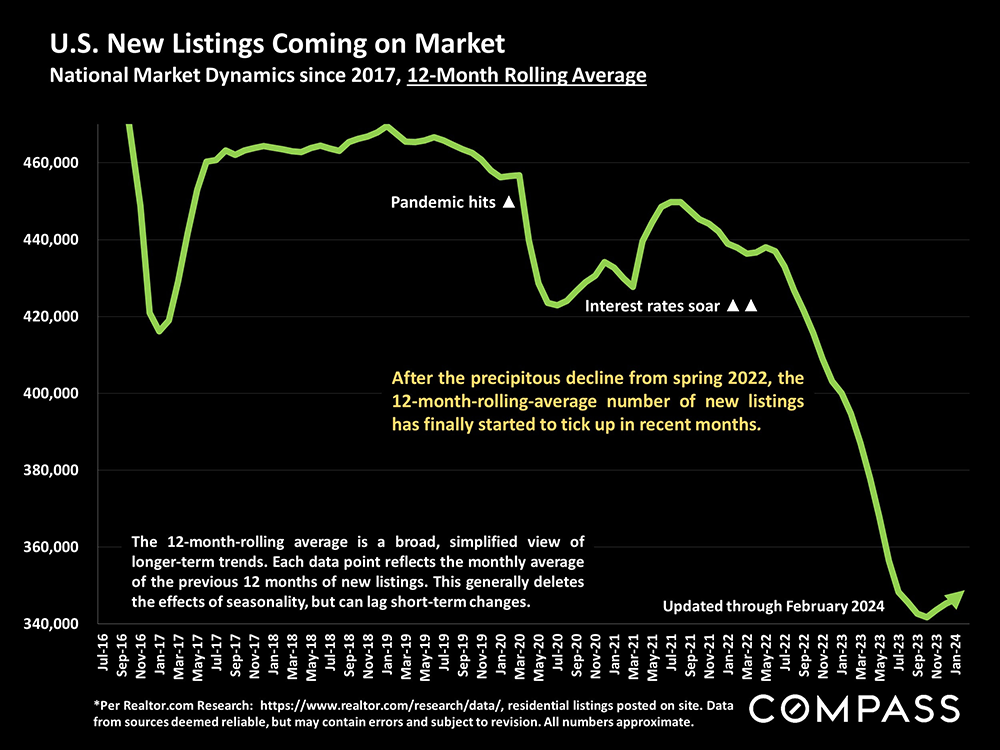
A broad illustration of the 12-month-rolling, average number of new listings coming on market: After falling for 18 months, the trend line is finally turning up again. On a single-month basis, new-listing numbers typically climb rapidly through spring.
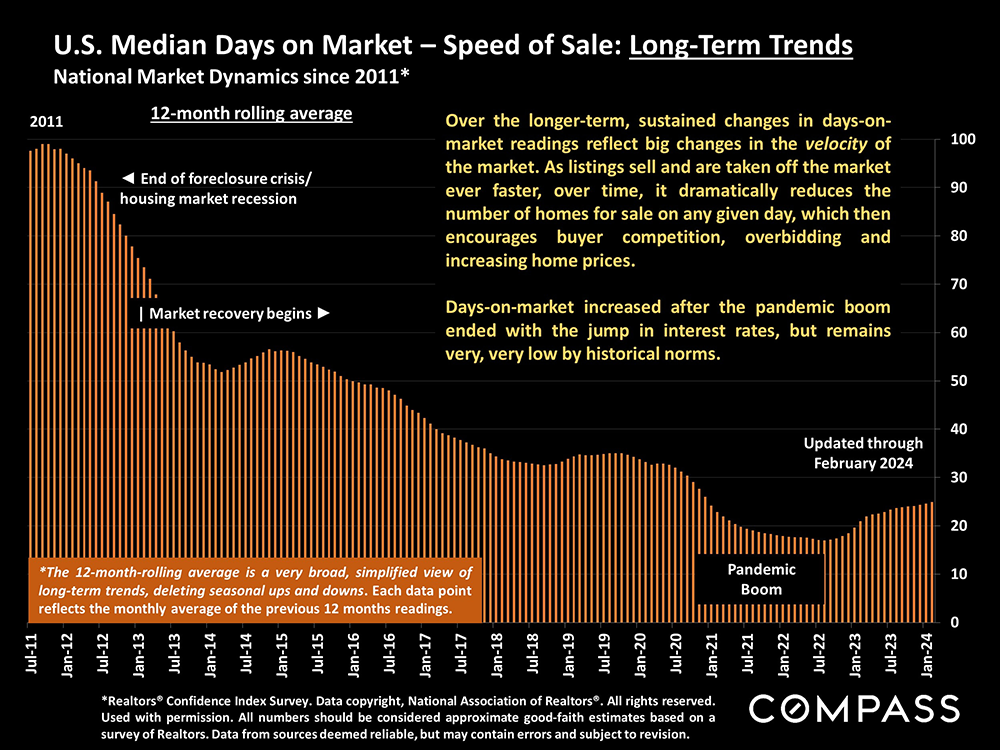
A broad, 12-month-rolling illustration of how quickly listings have sold since 2011: Not as fast currently as during the (overheated) pandemic boom, but very fast by long-term standards. On a single-month basis – not illustrated here – days on market fluctuate by month, usually hitting their lowest readings in spring.
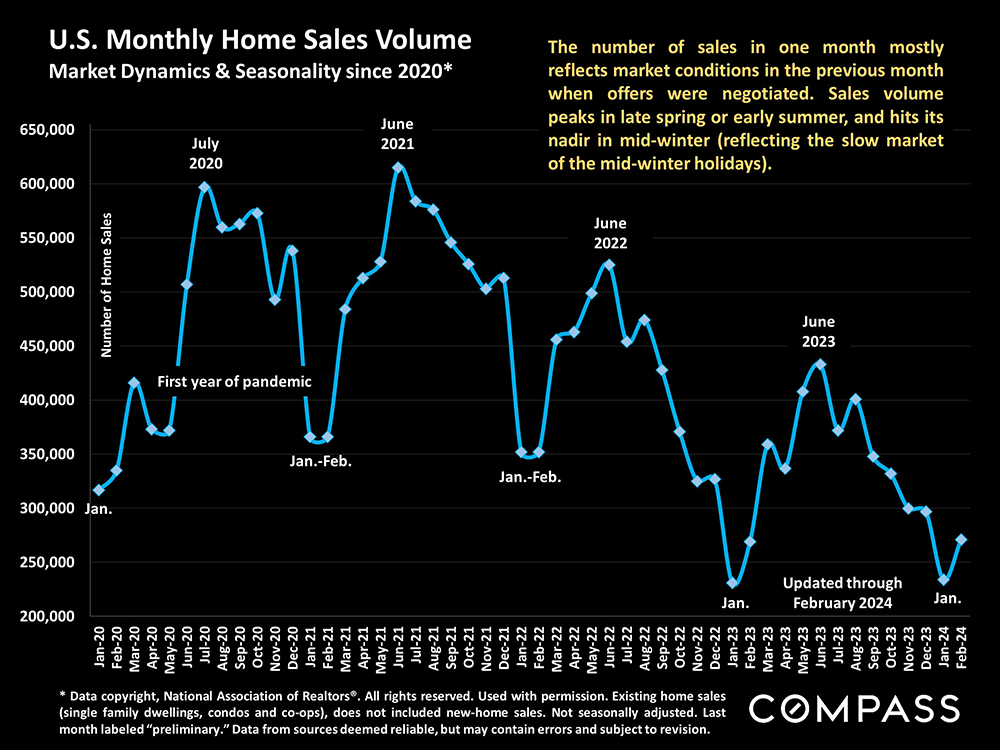
The number of sales is rebounding from its usual mid-winter low, and will continue to increase through spring, but interest rates and the extremely low inventory of listings for sale have caused a large decline in sales volumes.
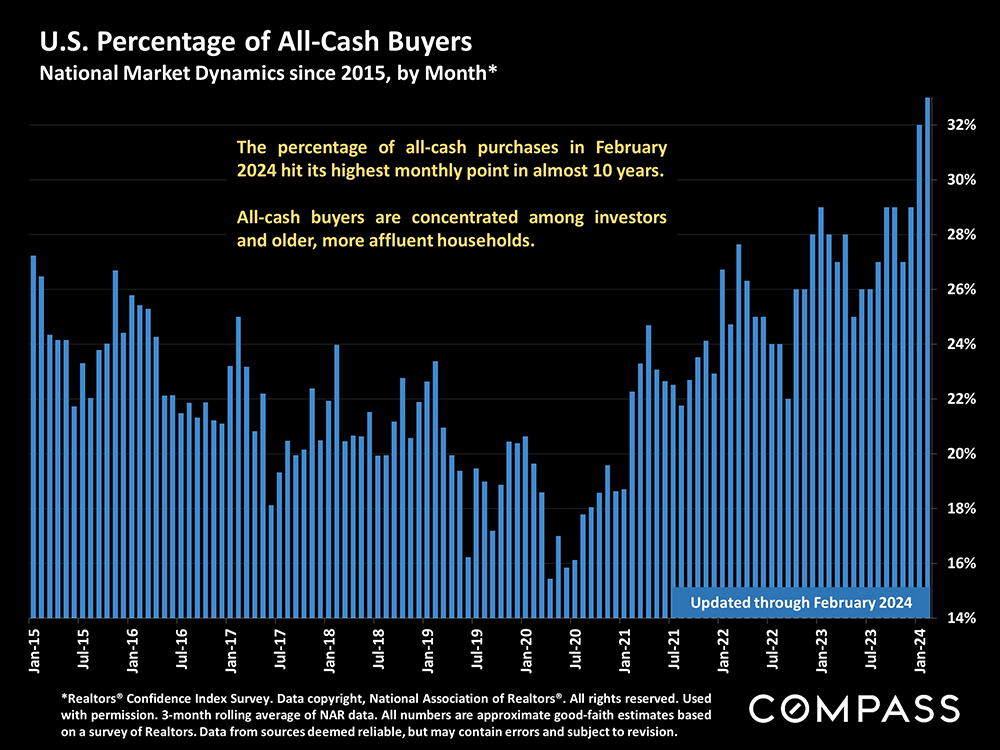
The percentage of homes selling all-cash has continued to rise. First-time homebuyers have faced increasing competition from investors and more affluent homebuyers with the ability to purchase without a loan.
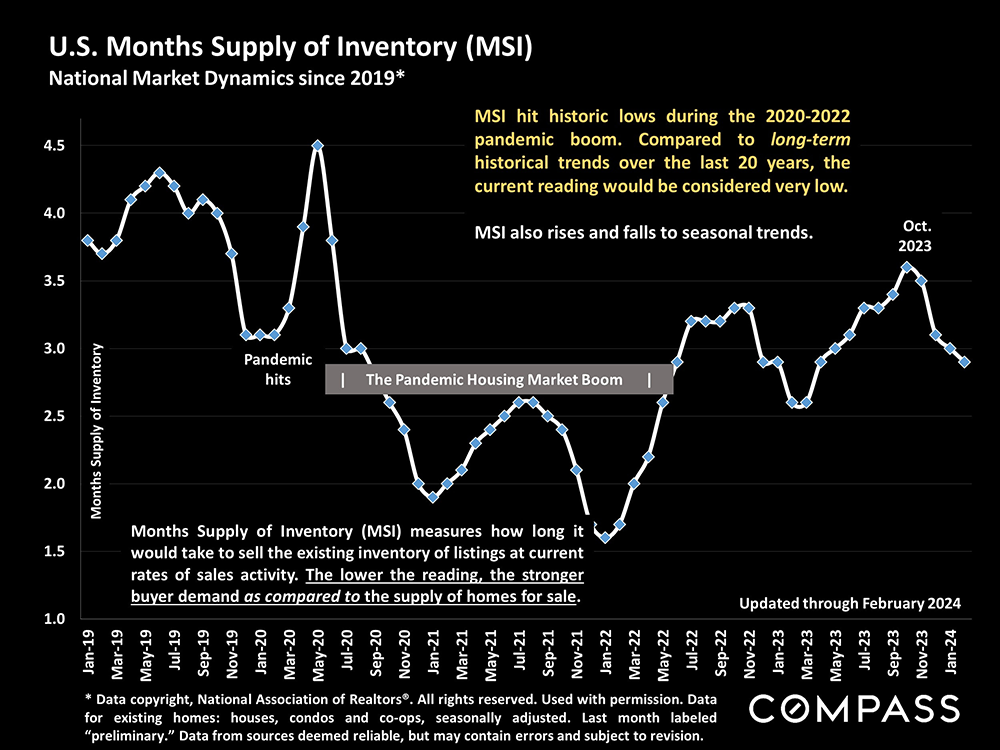
Months-supply-of-inventory compares buyer demand to the supply of homes for sale: The lower the reading, the more competitive the market. The current reading of 2.9 months, though higher than during the pandemic boom, is very low by pre-pandemic norms – mostly due to the inadequate supply of listings.
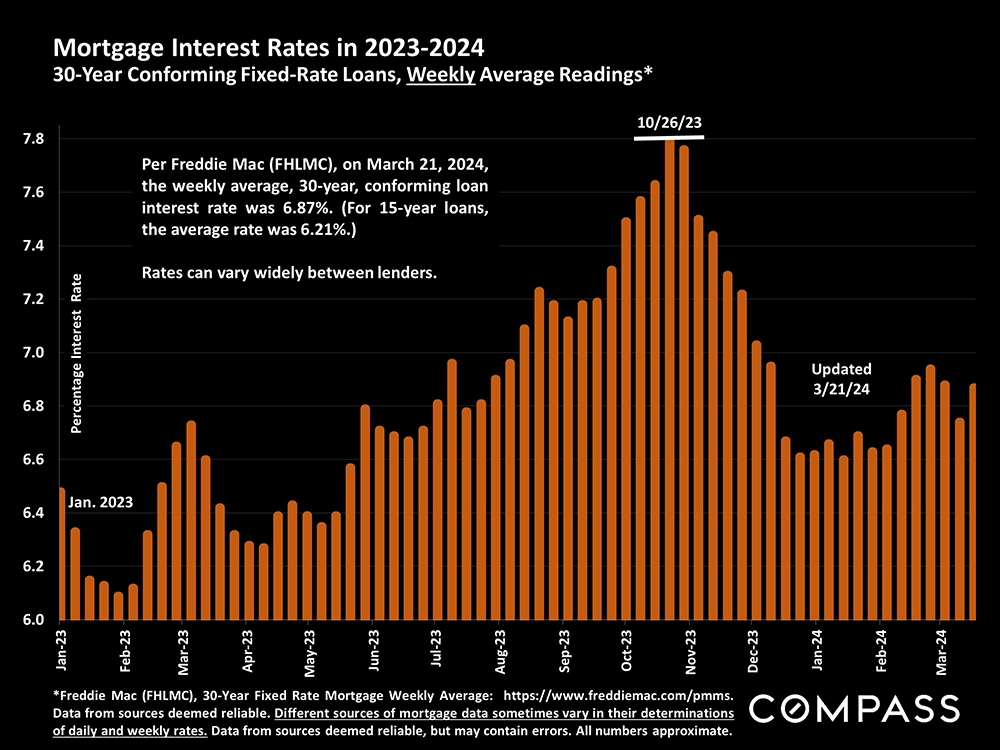
After the large decline from late October, mortgage interest rates have been fluctuating within a relatively narrow range of values in 2024.
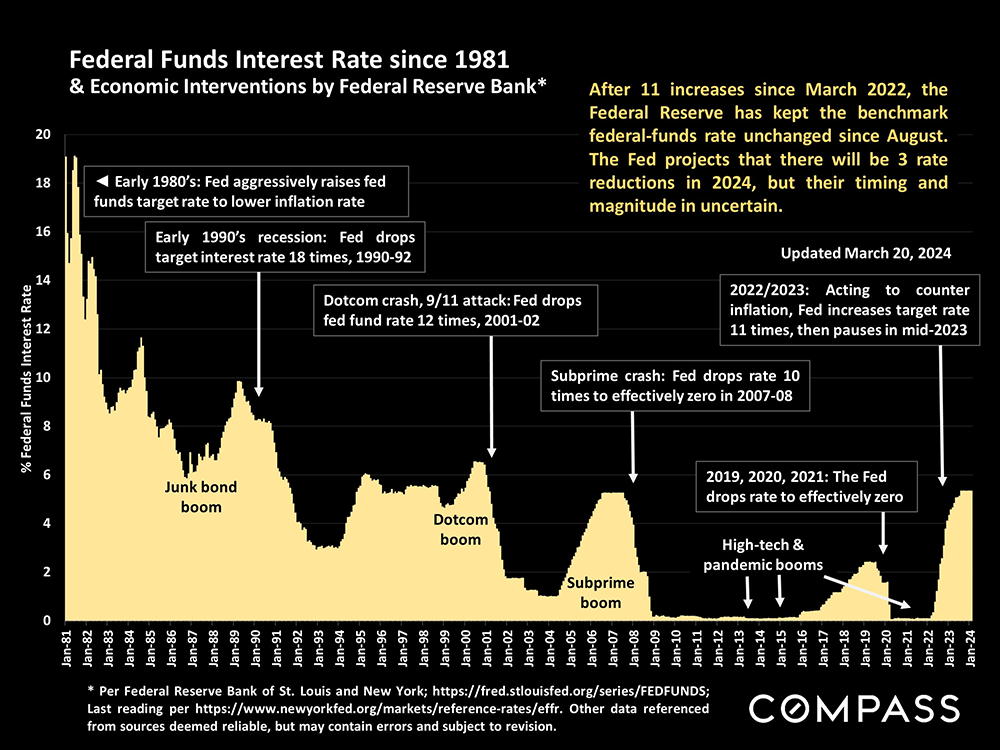
For decades, the Federal Reserve Bank has played a huge role in financial and housing markets via the setting of their benchmark rate. Inflation has plunged since mid-2022, but remains higher than the Fed likes, and this has kept the Fed in a holding pattern since August. Rate reductions are still expected to occur in 2024.
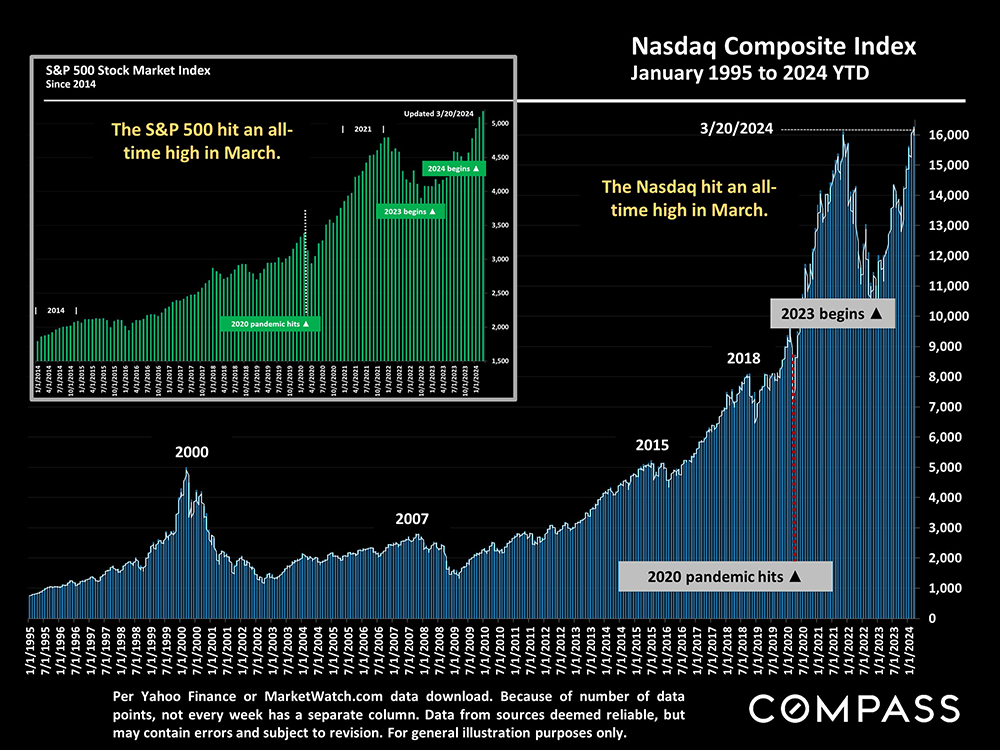
Stock markets hit new highs in March, an enormous factor – especially for more affluent households – in wealth, consumer confidence, and the ability to pay all-cash for homes.
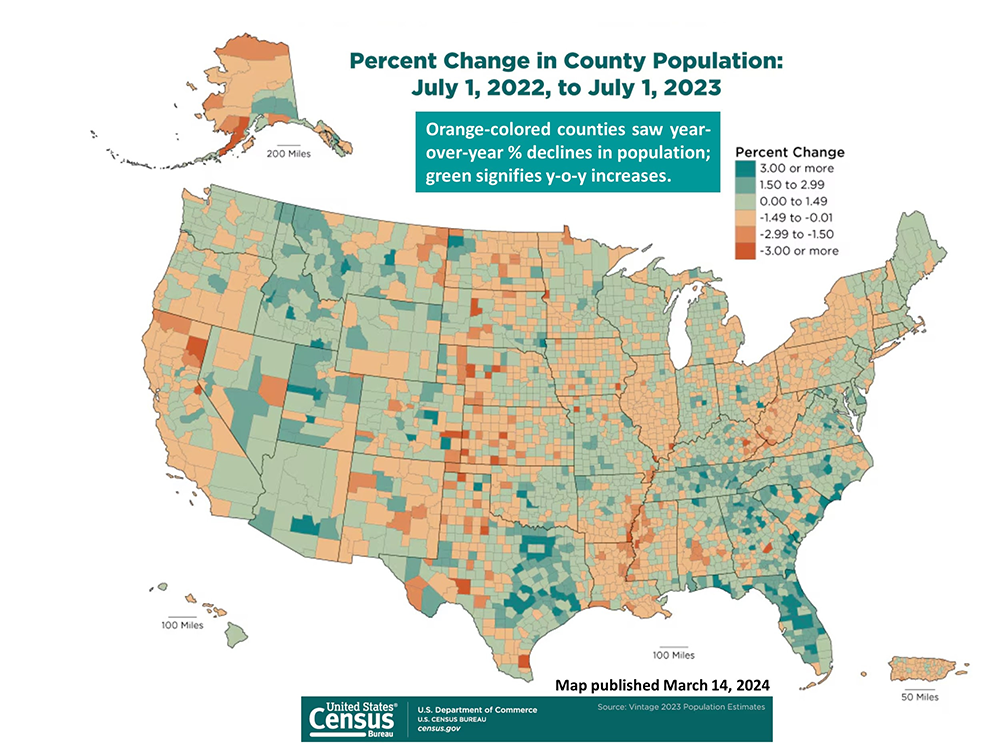
The new U.S. Census map illustrating county population changes 7/1/22 to 7/1/23: The magnitude of changes – mostly due to migration – has declined from 2020-2022, but remains a major factor in many local markets.
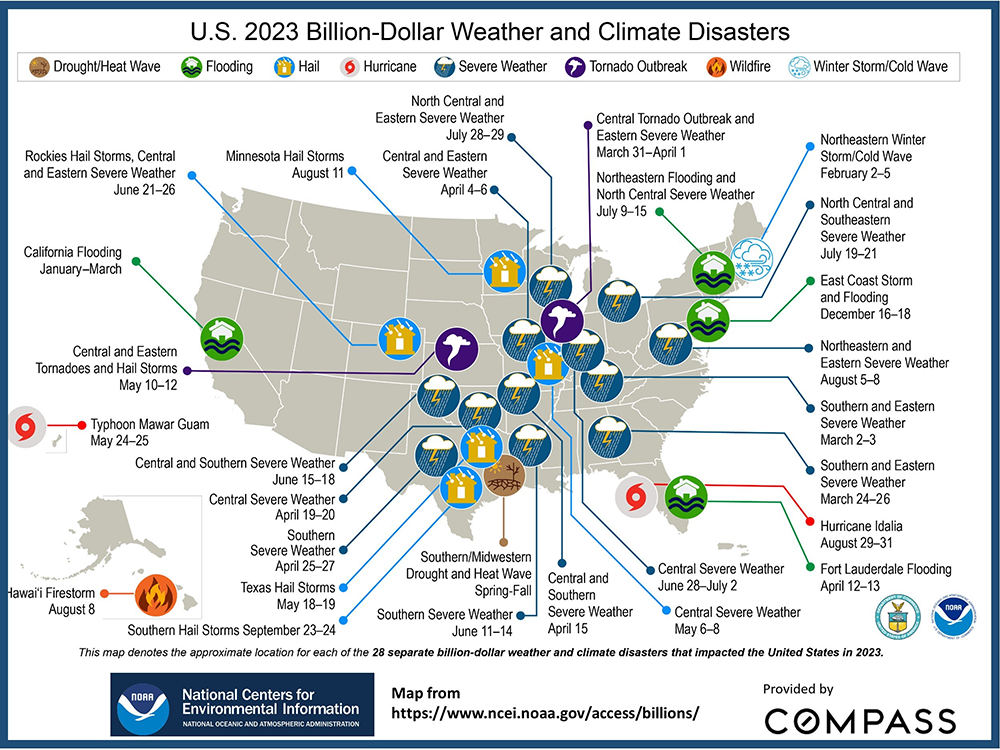
National homeowner’s insurance rates have increased 23% in the last 14 months, with some communities seeing much larger hikes – to crisis points. The main factor: In inflation-adjusted dollars, the average, annual cost of “billion-dollar-plus” natural disasters has gone from $21.5 billion in the 1980’s to over $144 billion in 2021-2023. Below is the NOAA billion-dollar natural disaster map for 2023.
Amid various economic ups and downs, the prevailing market dynamic since the great recession has been too few homes available to buy. Click on the image below for our full review of the major factors at play.

Please let me know if I can ever be of assistance, in any way, to you or your family, friends and colleagues.