To begin the new month, we wanted to share some fun facts about February:
Length Discrepancy: February is the only month that can have either 28 or 29 days. It typically has 28 days, but in leap years, which occur every four years, February has 29 days.
Named After Februa: February is named after the Latin word “Februa,” which means purification. It was named after a Roman festival held on February 15 called Februalia.
Birthdays of Presidents: February is notable for containing the birthdays of two U.S. Presidents: George Washington (February 22) and Abraham Lincoln (February 12). In the United States, Presidents’ Day is celebrated on the third Monday of February.
Valentine’s Day: The most well-known celebration in February is Valentine’s Day, celebrated on February 14th.
If you have any questions, please do not hesitate to reach out.
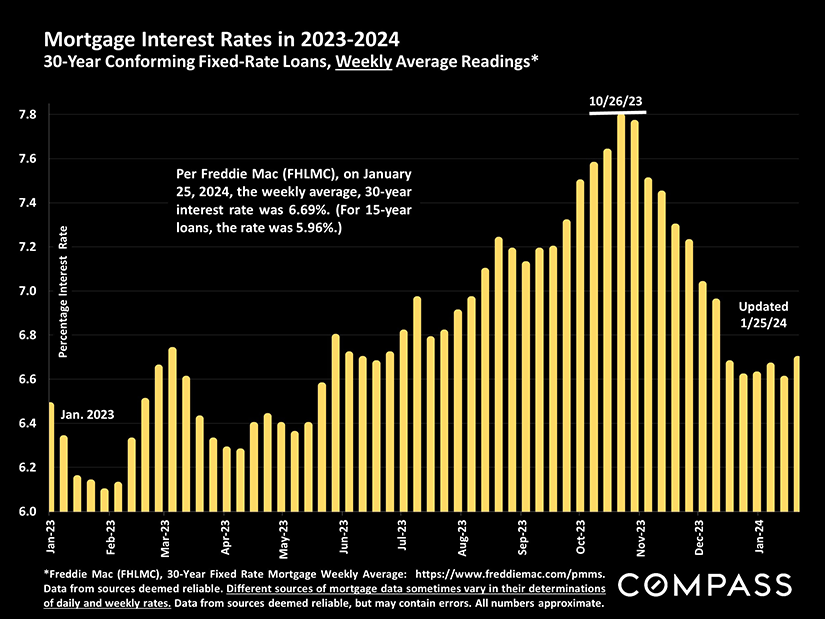
After their steep plunge in November and December, interest rates leveled off in January, but remain at their lowest point since spring 2023.
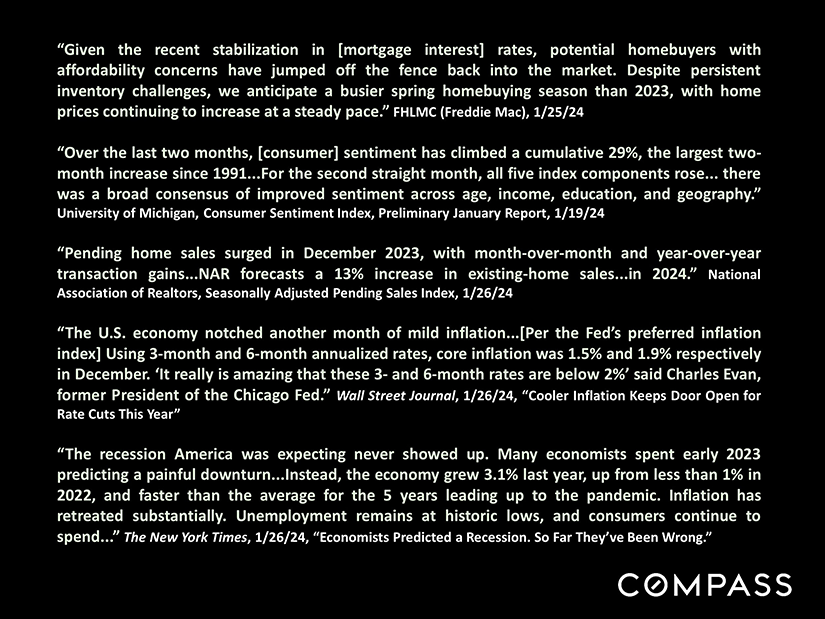
A huge improvement in consumer confidence occurred in the last 2 months: Economic optimism is a critical driver of buyer demand.
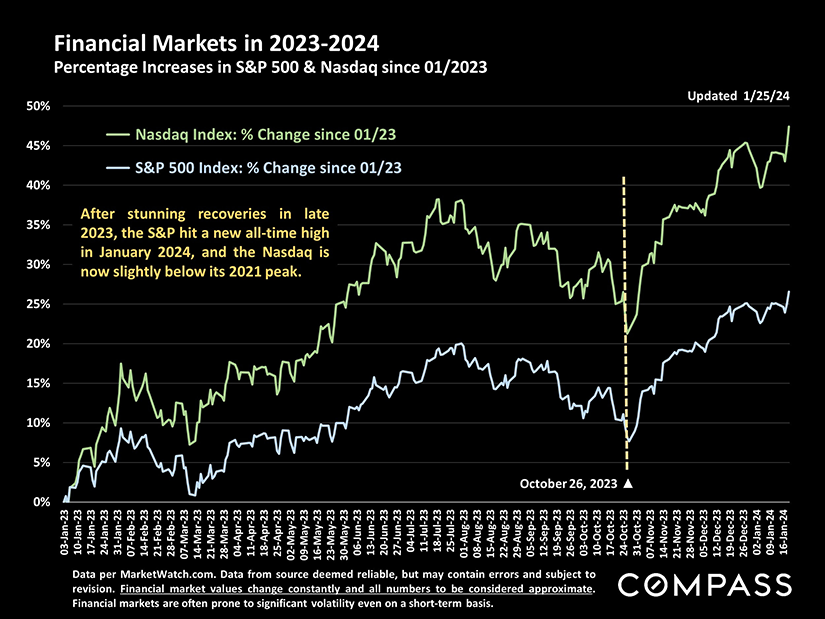
Changes in financial market values impact household wealth, consumer confidence, and housing markets. Stock markets have soared since late October.
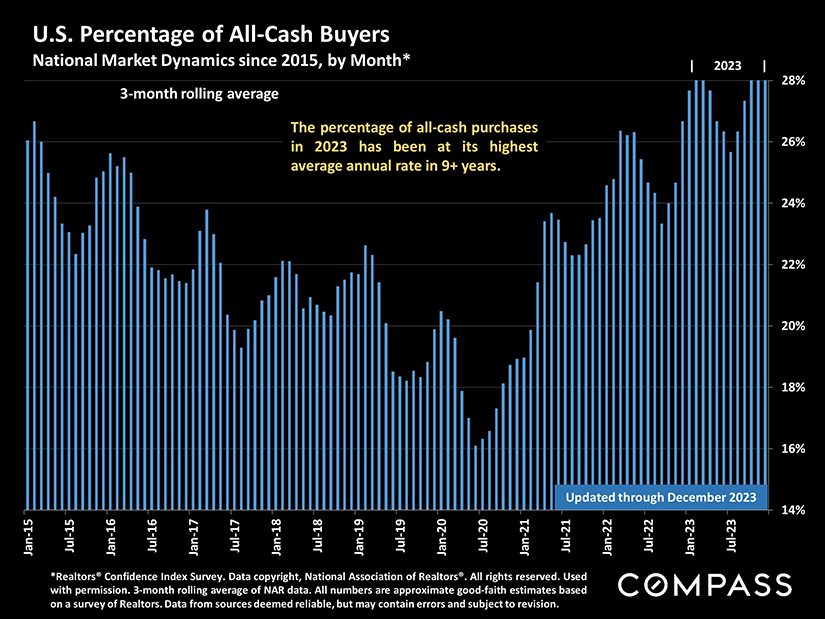
In recent years, investors have played an outsized role in the market as they’ve aggressively competed with ordinary homebuyers for listings.
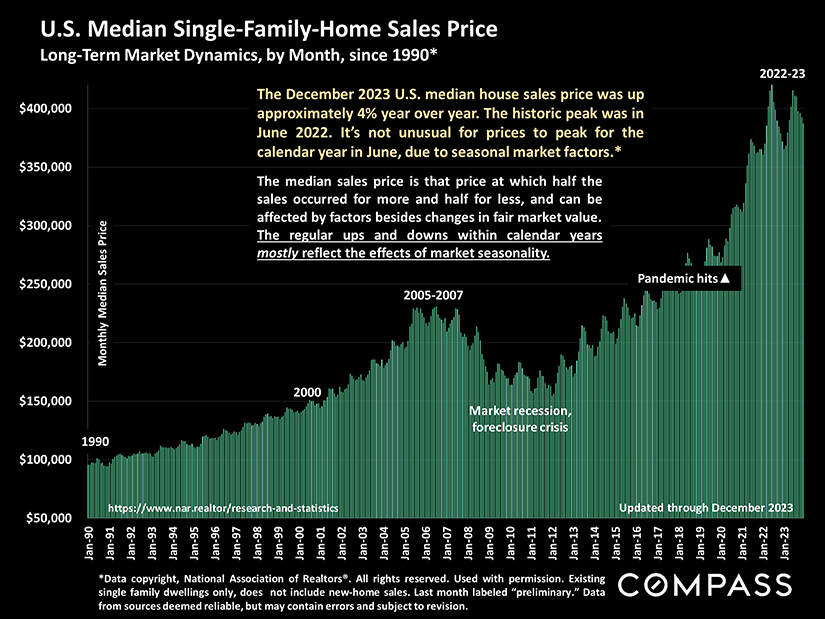
National median house sales prices in 2023 came very close to the spring 2022 peak. Recent monthly prices are up on a year-over-year basis.
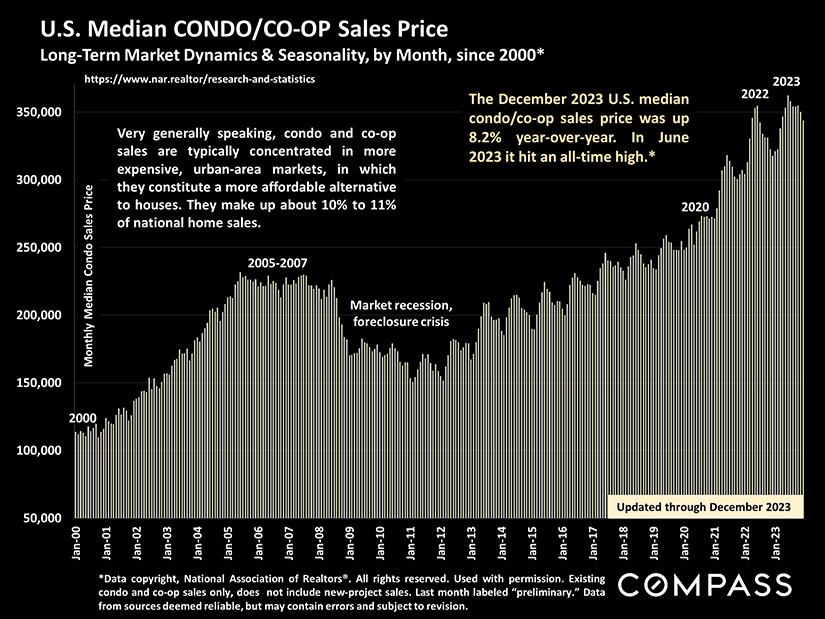
Perhaps due to their relative affordability in the markets in which they’re common, the median condo/co-op sales price hit an all-time high in 2023.
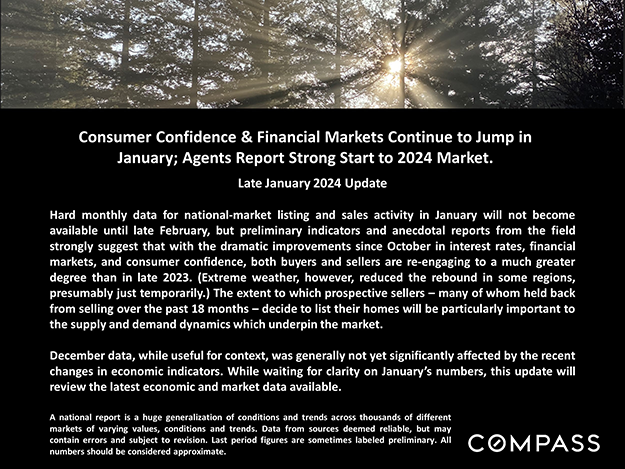
Late 2023 market data wasn’t significantly impacted by the improvements in economic conditions that began late last year. January data, due in late February, will be a much more important indicator, but the following charts illustrate trends and conditions in recent years, as well as the dramatic role of seasonality.
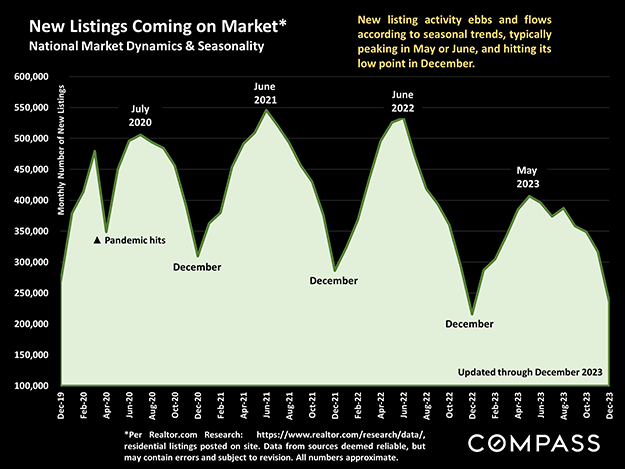
The number of new listings plunged since mid-2022, and December normally sees the lowest number of the year. Preliminary weekly data has early-2024 new listing activity up year-over-year. New listings typically climb rapidly through spring.
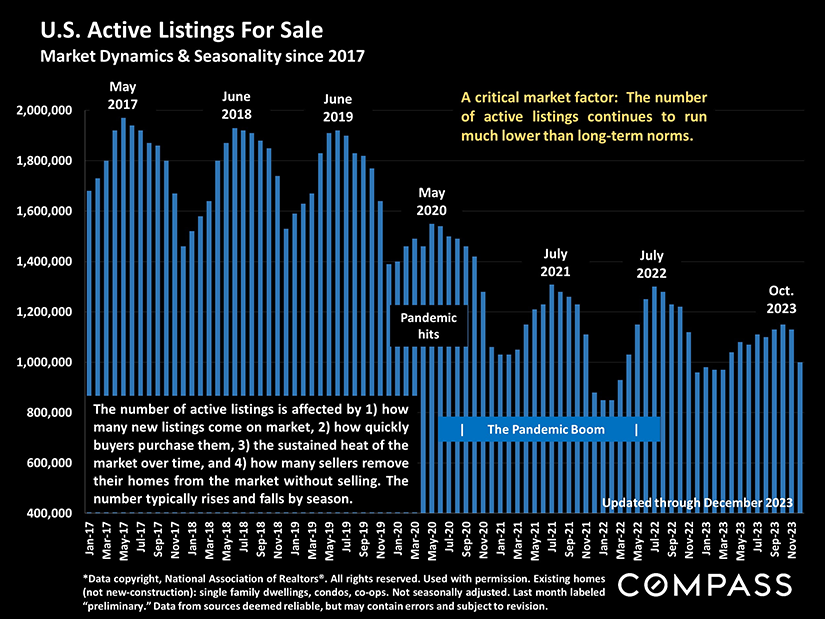
The inventory of active listings is mostly determined by the number of new listings, and how quickly buyers snap them up. Inventory rises rapidly as the new year’s market wakes up, but will probably remain well below long-term norms.
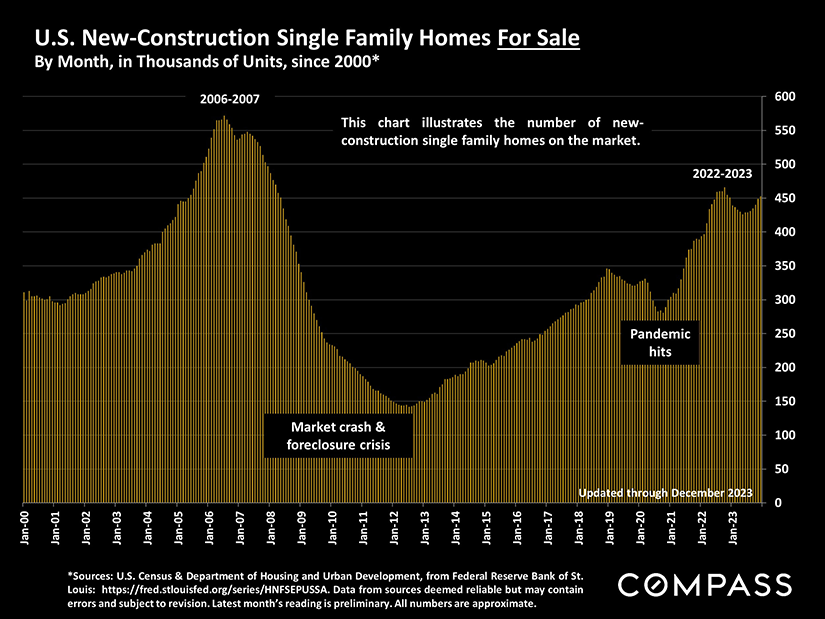
While many homeowners have held back from listing their homes, the inventory of new-construction houses is approaching its 10-year high in 2022. Developers are eager to take advantage of unmet buyer demand.
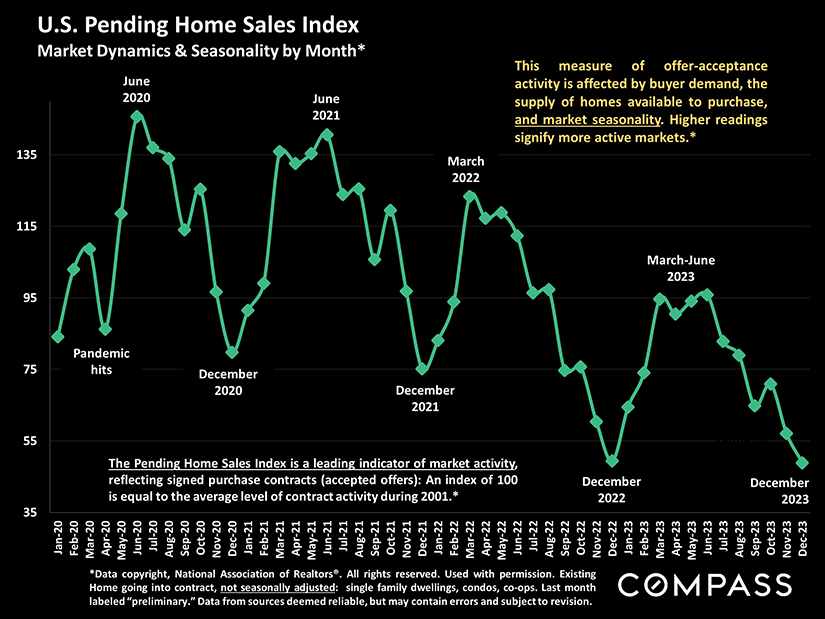
Accepted-offer activity is a leading indicator for near-future sales. It usually hits its low point in December, then heats up quickly moving into spring.
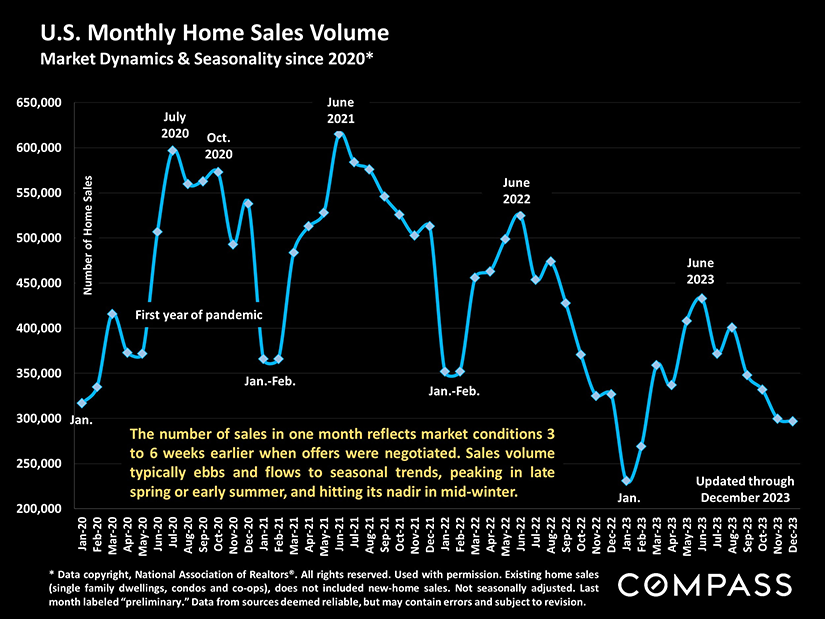
Sales generally follow offer acceptance by 3-6 weeks, the typical period from contract negotiation to close of escrow. 2023 sales were far below historical norms.
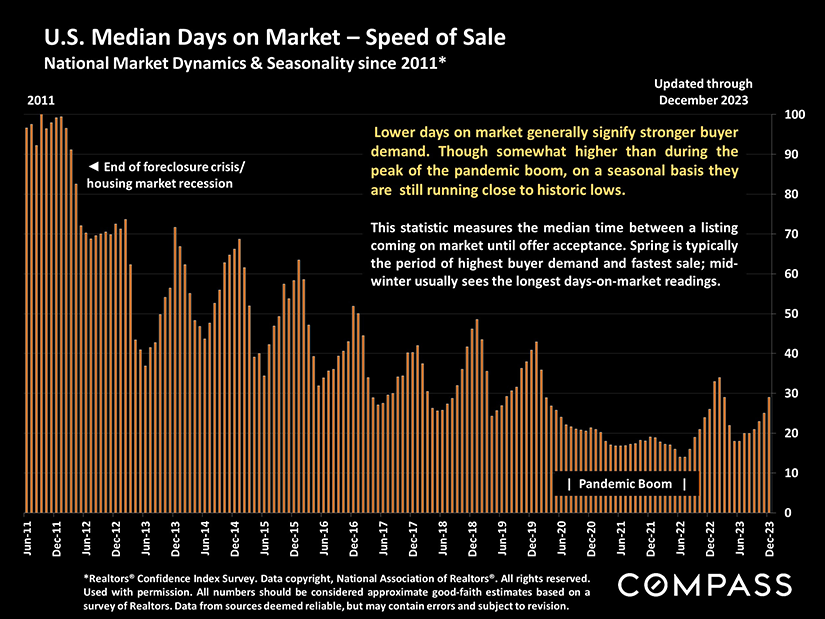
The speed at which homes go into contract reflects the heat of demand. As with almost all market indicators, it ebbs and flows by season.
The speed at which homes go into contract reflects the heat of demand. As with almost all market indicators, it ebbs and flows by season.
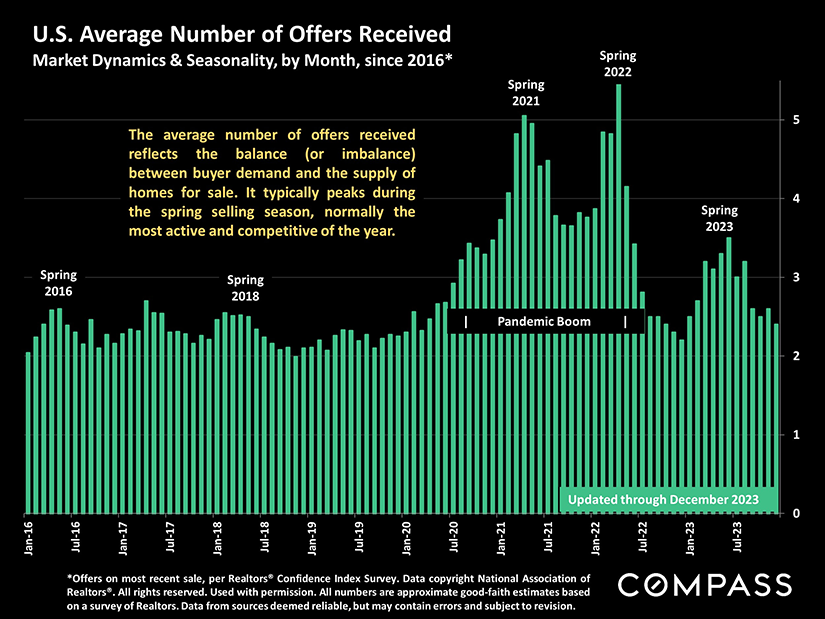
Multiple offers are an indication of buyers competing for a limited supply of well-priced listings. Competition is the main driver behind home-price increases.
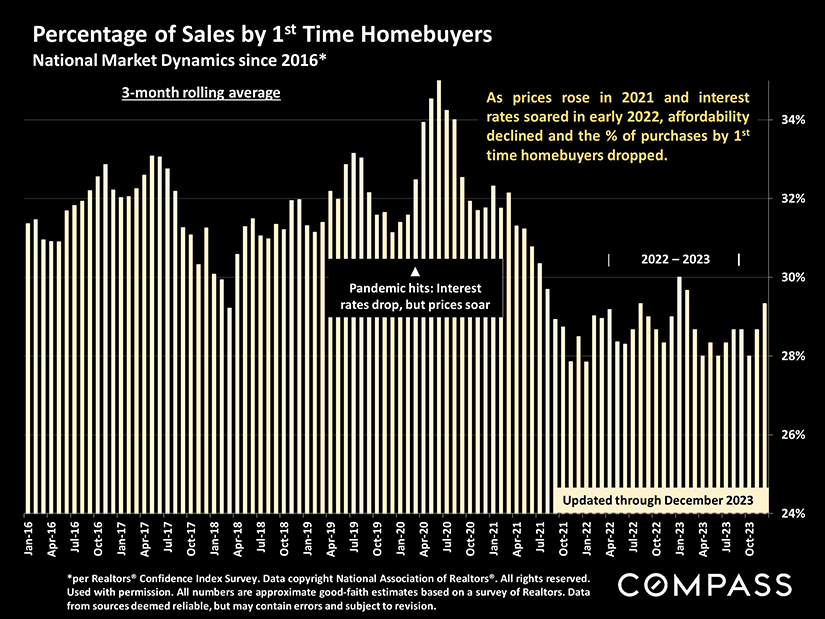
The % of first-time homebuyers remains low, a classic example of repressed demand: They want to buy, but economic conditions have not cooperated.
Please let me know if I can ever be of assistance, in any way, to you or your family, friends, and colleagues.